Three simple methods for effectively controlling cedar are described in L-5160, “Brush busters: How to Master Cedar”. These methods control small cedar before they mature, thicken and require expensive mechanical control methods. Brush Busters recommends only “select” treatments, which normally kill at least 7 out of 10 cedars treated. The Brush Busters methods allow you to selectively eliminate the cedars you don’t want, and to leave the other plants you value. Brush Busters methods often are less expensive than mechanical control methods.
By following the simple directions that follow, you’ll be able to determine the density (abundance) of cedar on rangeland or improved pastures and then estimate the cost of controlling these plants with any of the three Brush Busters methods. Your actual costs may vary considerably from the estimate you develop using this website, depending upon the size of your plants, the efficiency of your workers, and the type of equipment you use. Costs given for spray ingredients are 1998 retail prices. Labor is estimated at $6 or $12 per hour. The cost data were collected on rangelands infested with small cedar that ranged from a few inches tall to more than 6 feet tall (average of 2 to 3 feet tall).
Step 1. Estimate cedar density (number of plants per acre).
- Select a representative area in your pasture. Pick a landmark on the horizon or some object in the pasture and walk 363 feet (this is about 121 big steps) toward that landmark or object. Stop. (If large bush prevents seeing 363 feet or walkin in a straight line, see Note below.
- Turn around and slowly return along a straight line to your starting point. As you proceed, count every small cedar rooted within 3 feet of your path (about an arm’s length on both your right and left sides).
- To calculate the number of cedar per acre, multiply the number of cedars counted along the line by 20. For example, if you counted eight cedars, then the density is 160 cedars per acre (8 x 20).
- Repeat this procedure in at least three more representative areas.
- Total the samples, then divide by the number of samples to calculate an average cedar density for your pasture. This average will be the “plants/acre” value you will use in Step #2. Example: If you had four estimates of 160, 100, 60, and 80 plants per acre, then your average plant density is 100 plants per acre. (160+100+60+80=400; 400 divided by 4=100)
Note: An alternative method is to mark off a square area 66 feet (about 22 big steps) on a side. Count the number of small cedar rooted in this area, then multiply the number by 10 to calculate the number of cedars per acre. Repeat this procedure in at least three more representative areas, then calculate the average cedar density for your pasture.
Step 2. Use the graphs to estimate cost per acre.
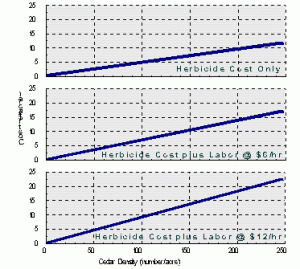
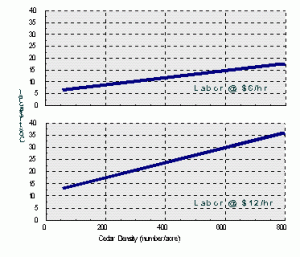
- Find the appropriate figure below for the Brush Busters method you will use. (Figure 1 is for the leaf spray method. Figure 2 is for the soil spot spray method. Figure 3 is for the top-removal method). In figures 1 and 2, the upper graph shows the cost for the spray only. The center graph shows total cost for spray + labor at $6 per hour. The bottom graph shows total cost for spray + labor at $12 per hour. Figure 3 shows the costs for the top-removal method, with labor at $6 per hour in the upper graph and $12 per hour in the lower graph.
- Locate your average cedar density (the average calculated in Step #1) on the lower, horizontal axis (density axis) of the graph for the method you choose and your labor costs. Draw an imaginary line straight up from your average cedar density to the center of the bold sloping line on the chart.
- From the point at which the imaginary vertical line intersects the bold sloping line, draw an imaginary, horizontal line to the vertical axis (cost axis) on the left side of the chart. Make a mark on the cost axis. This point is an estimate of what your cost per acre should be in $/acre. Example : If you have an average of 100 small cedars per acre, you’re using the Brush Busters leaf spray method (see Fig. 1), and your labor cost is $6 per hour, then the estimated cost of treatment is about $13 per acre
Figure1. Costs for controlling various densities of small cedar with the Brush Busters leaf spray method.
Figure2. Costs for controlling various densities of small cedar with the Brush Busters soil spot spray method.
Figure3. Costs for controlling various densities of small cedar with the Brush Busters hand grubbing method. Upper graph shows the cost with labor at $6/hr. Lower graph shows the cost with labor at $12/hr. These cost data are for cedars ranging from a few inches to 28 inches tall (average height about 1 foot).
Keep these points in mind:
- If the estimated cost greatly exceeds $30 per acre, you may wish to consider using prescribed fire or a mechanical treatment if the acreage and location of your cedar infestation will permit the use of fire or heavy machinery. Prescribed fire can be very effective in killing small cedar.
- Cedar size is a major factor affecting the cost of Brush Busters methods. Costs escalate rapidly as cedar size increases.
- Costs can escalate rapidly if you apply leaf sprays using excessive pressure or nozzles with large orifices.
- Labor is usually a major component of total cost with Brush Busters methods. Costs escalate rapidly as hourly labor cost increases and when workers are inefficient in the use of their time.
- The estimated costs of controlling cedar by hand grubbing presented in this brochure were determined where average plant height was only about 1 feet. No cedars more than 28 inches tall were grubbed. Hand grubbing redberry cedars more than 2 feet tall will require very strenuous work. Blueberry cedars can be cut near the soil surface with an axe or pruning shears.
- Follow direction in L-5160, “Brush Busters: How to Master Cedar,” very carefully.
- Cedar control must be used in conjunction with proper stocking rate and livestock grazing management to realize the benefits of increased forage and livestock production.
| Figure 1 |
 |
| Figure 2 |
 |
| Figure 3 |
 |