Rudi Reinecke, Richard Conner, and Amy P. Thurow
Introduction
Over the past 150 years Ashe juniper has increased its dominance over much of Texas’ grazinglands. In recent years its rate of invasion has increased, especially in the Edwards Plateau. Grazingland owners/managers traditionally achieve income and/or satisfy other goals via use of their resource as a source of food and habitat for livestock and wildlife. As Ashe juniper increases, however, forage production is suppressed. (Figure 1) (Rowan and Conner 1994). This reduction in forage production is due to decreased light penetration below the juniper canopy and increased competition for water and nutrients (Yager 1993, Fuhlendorf 1992) and results in decreased carrying capacity, individual animal performance and income from grazing animals. Although wildlife use Ashe juniper for food and cover, dense stands of juniper also suppress the variety of desirable forbs and insects necessary for good wildlife / endangered species habitat (Rollins and Armstrong 1994, Kroll 1980). Additionally, lower aesthetic value and biodiversity associated with dense cedar stands create situations that are unattractive to those wishing to view unique habitats and species.
For these reasons, and others discussed at this symposium, grazingland managers in the Edwards Plateau and other areas being invaded by Ashe juniper are interested in management practices that suppress its dominance. However, selection of a brush management program or system to aid in achievement of livestock and wildlife enterprise goals has generally been problematic for grazingland managers, primarily because of the difficulty associated with estimating the impacts of a practice or system of practices on their enterprise goals. This chapter addresses the cost effectiveness of selected management systems for six different brush density scenarios based on their estimated impact on a livestock grazing lease enterprise. Leased-grazing income represents only a small subset of the enterprise goals pursued by typical grazingland owners / managers. None the less, this cost effectiveness profile provides a foundation for analyzing economic options and could be extended to describe enterprises such as lease-hunting and nature-based tourism.
Woody Cover Examples
Ashe juniper coverage varies across the Edwards Plateau. Ashe juniper coverage is more significant in the eastern than in the western portion of the plateau. Additionally, there is considerable variation between sites and management units (ranches and or pastures) due to differences in soils, previous management practices across the plateau, ect. To illustrate the potential differences in cost effectiveness associated with the woody cover variation, sites representing six different tree density/ age class
Table 1.
| Tree Size Category | Stem Diameter (in) | Canopy Diameter (ft) | Canopy Area (ft2) |
| Small | <½ | <2 | <3.1 |
| Medium | 3-6 | 6.5-8 | 33.8 |
| Large | >12 | >16 | 201.1 |
situations were selected (Figure 2) (Garriga 1997). The first scenario has 3% cover and each scenario there after increases at an increment of 15% (i.e. 3, 15, 30, 45, 60, and 75%).To characterize the six woody cover class scenarios, three tree size categories were selected (Table 1). Canopy area and diameter were calculated from Fuhlendorf (1992). Tree size/age distribution affects selection of the appropriate brush management technique and its cost and effectiveness. The three tree size categories were separated into a seedling / sapling category (small) and two tree categories (medium and large). The small category was delineated due to its potential growth after the overstory dominance is removed. This small tree category exists primarily under the canopy of large size class trees. The major difference between the medium and large tree categories is the reduction of herbaceous vegetation under the canopies.
Ashe juniper, depending on historical management, rarely contributes to complete dominance of the woody vegetation on the western edge of the Edwards Plateau. Data from the Sonora Research Station indicate that Ashe juniper constitutes 30% of the total woody cover (Smeins et al. 1994, Fuhlendorf unpublished data). This indicates that Ashe juniper is rarely the sole source of canopy cover within each of these sites. Many small and medium category trees grow within the understory of other woody plants (i.e. live oak and shinnoak). Reinecke (1996) indicated that small and medium sized Ashe juniper trees had 30% canopy cover within the understory of live oak mottes.
Table 2 characterizes Ashe juniper stem densities per acre for the six scenarios. Stem densities of the medium and large size / age categories were derived from Blomquist (1990), Fuhlendorf (1992), Smeins et al. (1994), and Fuhlendorf et al. (1996). The small tree stem densities were calculated based on the density of the large tree categories and data from Reinecke (1996).
Management Scenarios
Considerable variation across the Edwards Plateau and between management units and sites make ‘cookbook’ management prescriptions difficult. In addition, the resulting increase in herbaceous production caused by reduction of woody cover is variable with site productivity, precipitation and grazing regimes. We assumed that the goal for each scenario was to reach and maintain a near – zero juniper cover. For purposes of this economic analysis, this meant that all woody cover would be suppressed as a result of the management practice because of the interspersion and density of all woody species.
Economic evaluations were conducted on viable brush management practices for the six cover scenarios. For each scenario, an appropriate management practice was selected based on stem densities of the different tree sizes. Each management practice was planned for initiation in year 1 of a 12 year planning horizon. All cost and returns information associated with implementation of a management practice and its expected effects on the grazing lease enterprise are presented on a per acre basis so that managers could easily use the results for applications to any size management unit and / or application patterns designed to enhance the biodiversity of a management unit. The first site, unlike the other scenarios, required only a
Table 2. Percent total woody cover with corresponding Ashe juniper cover and estimates of Ashe juniper stem density per acre per tree size category for the six woody cover estimates (including open grown and those calculated to be growing under canopies of oak mottes).
| Total woody (% cover) | A. juniper (% cover) | # of Small Trees per Acre | # of Medium trees per Acre | # of Large Trees per Acre |
| 1 (3%) | 3% | 90 | 0.00 | 0.00 |
| 2 (15%) | 4.5% | 229 | 60 | 11 |
| 3 (30%) | 9% | 535 | 122 | 28 |
| 4 (45%) | 13.5% | 671 | 237 | 32 |
| 5 (60%) | 18% | 860 | 287 | 40 |
| 6 (75%) | 22.5% | 1022 | 317 | 46 |
maintenance management scheme. To maintain low woody cover, a prescribed fire is planned for year 1 and a maintenance fire in year 8. The second site has medium and large juniper trees that would not be controlled by fire. Therefore, individual treatmentwith herbicides (Velpar L soil spot treatment at 2cc per 3 foot of canopy height) is planned for these trees. To limit the small juniper trees from gaining dominance, a deferment and prescribed fire are planned for year 2 followed by a maintenance fire in year 8. All other woody cover examples require a mechanical treatment to remove the medium and large sized trees. Since substantial densities of small trees will remain following mechanical brush management practices, deferment and prescribed fire are planned for year 2 followed by a maintenance fire in year 8. The mechanical treatments were rollerchopping for scenarios 3 and 4 and double chaining for scenarios 5 and 6.
Results
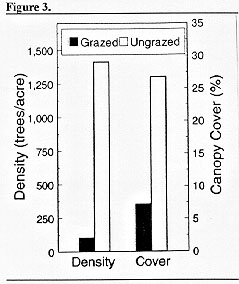
Sites with considerable juniper cover respond to brush management practices with significant increases in annual herbage production whereas sites with little juniper initially result in less significant increases following a management treatment (Figure 3). This is primarily the result of medium and large junipers’ ability to reduce herbaceous biomass within the canopy of individual trees. Conversely, however, costs of the management practices are usually more expensive for the high-density brush stands compared to sites with low percent brush canopy.
For simplicity, the economic evaluation of each of the management scenarios was based solely on grazing lease revenues and the costs for the management practices. Stocking rates, and hence lease revenues, were derived from estimates of herbage production based on different densities of brush canopy (see Figure 1) and an assumed 25% forage grazing – harvest efficiency. Grazing lease revenue was estimated at $8.33 per animal unit month (AUM) ($5.27 per ton of herbaceous forage produced). Costs were estimated by a panel of TAES research and extension personnel familiar with brush management practices (Conner, McGinty, Taylor, Ueckert) (Garriga 1997). Per acre rates used are: prescribed fire ($4.50), maintenance fires ($3.50), herbicides ($0.06 per tree), rollerchopping ($25.00) and double chaining ($25.00). Deferment costs are based on the number of months deferred, the herbaceous forage production per acre and the lease rate ($8.33). Results are shown for both rotational and continuous grazing systems with no deferment costs included for the rotational grazing system. No cost sharing from soil and or water conservation programs was included due to their limited availability.
Juniper management in all scenarios yielded positive results (Figure 3). As expected, the management scenarios provided more benefit (increase in forage production) for sites with dense woody cover than for those with little cover. Similarly, the cost of the management practices increased for the denser brush stands. For each of the sites / scenarios, Table 3 shows the average annual internal rate or return on the investment in the management program based on changes in grazing lease revenues and the net cash flow per acre for the entire 12 year planning horizon. Two cases are shown for each scenario; one with rotational grazing and one with continuous grazing. The primary difference in the two is that we assumed that the rotational grazing system could effectively defer pastures before and after prescribed burns at no cost whereas additional pasturage would have to be leased with continuous grazing.
Sites with initial low percent brush canopy, 15% or less, clearly exhibit the highest net cash flow from the combination of grazing lease revenue and costs of implementing the control measures. Internal rate of return (IRR) is a measure of the difference between the cost of the practices and the added lease revenue due to implementing the practices expressed as an average annual percent of the cost of the practices. Thus, a negative IRR indicates that the practice would not be expected to generate enough additional lease revenue to completely offset the cost of the practices during the 12-year planning period. Table 3 shows that the IRR is least for scenario one because the investment cost, although quite low, results in little change in lease revenue because the practice is designed to prevent brush establishment and maintain forage production at close to its initial level. In contrast, once a site reaches a situation where mechanical means are necessary to reduce the woody dominance (sites 3-6), net cash flows dramatically decrease, but the additional grazing lease revenue resulting from implementing the control practices will almost equal, or in some cases with rotational grazing systems exceed, the cost of implementing the practices.
Additional Considerations
Up to this point, we have focused on revenues being based on the amount of forage produced per acre. Many ranches on the Edwards Plateau use a diversity of enterprises to maximize profits. Goat production, either Angora (mohair) or meat goats; can have beneficial impacts on suppressing the invasion of Ashe junipers. It has been noted that goats voluntarily consume juniper to a point. Furthermore, periodic goat stocking at appropriate times, when seeds are germinating and seedlings are establishing, can reduce densities of small trees and retard the future development of brush cover dominance. In addition to reduced cover of juniper in pastures grazed with goats, the higher browse lines resulting from goat’s use of larger trees provide a more suitable environment for grasses to grow under the tree’s canopy (Reinecke 1996, Fuhlendorf 1992). This increased grass production could lead to greater stocking rates of grazing animals. Goat enterprises are most beneficial when the vegetation is similar to sites 2-5, particularly 3 and 4.
Loss of biodiversity is often a concern of managers when considering brush control. To keep biodiversity at acceptable levels managers can implement their brush management practices in patterns which leave strips or mottes of brush interspersed among the cleared areas. In many cases approximately 65-70% of the land area in a management unit may be cleared in a pattern without serious loss of biodiversity. A series of small brush-free areas are better utilized by wildlife due to the proximity of shelter belts. Increased stocking rates through multi livestock enterprises and increasing deer habitat could increase the net cash flows to make sites similar to 5 and 6 more affordable to control.
Another management technique which might be considered is the grazing system within the management unit. Not only does a deferred rotation grazing system allow for potential range improvement directly through rest, but it gives improvement practices the deferment necessary for their implementation. When brush management is an issue, a deferred rotation grazing system prevents the land manager from accruing deferment costs while he / she waits for the necessary fuel load for an effective fire. Table 3 indicates the economic importance of deferred grazing systems when considering brush management practices.
| Internal Rate of Return | Net Cash Flow | |||||||
| Scenario # | Rotational Grazing | Continuous Grazing | Rotational Grazing | Continuous Grazing | ||||
| 1 | -11.75% | -22.56% | $56.13 | $48.99 | ||||
| 2 | 4.69% | -5.86% | $49.55 | $42.66 | ||||
| 3 | -5.86% | -8.79% | $27.24 | $20.71 | ||||
| 4 | -2.34% | -5.86% | $25.74 | $19.55 | ||||
| 5 | 0.59% | -2.93% | $23.34 | $17.70 | ||||
| 6 | 1.17% | -1.76% | $23.51 | $17.83 | ||||
Prescribed fires are one of the least cost brush management methods and have excellent effectiveness on small juniper trees. The frequency of maintenance fires depends on the rate of juniper encroachment, which depends on several factors: precipitation, frequency and intensity of goating, etc. In addition, mortality of Ashe juniper by fire is highly dependent upon fuel load (standing crop of forage), which is also dependent on rainfall and deferment from grazing.
Summary
Brush management is a continuous process which requires constant diligence on the part of prudent resource managers. Neglecting or postponing brush management decisions can have significant negative impacts on goal achievement. Efficient use of grazinglands susceptible to brush encroachment often requires willingness to evaluate and implement a variety of management practices and / or animal enterprises depending on the relative density of the different brush size classes, etc. The following is a list of some major considerations:
1. Use fire at a frequency to maintain low percent brush canopy,
2. Use goats to retard brush canopy dominance or to maintain low percent brush canopy,
3. Use a deferred rotation grazing system to avoid accruing costs of deferring grazing to build fuel loads for prescribed burns, and
4. When brush size and density require mechanical treatments, maintain biodiversity and enhance goal achievement from multiple animal enterprises by clearing in brush in patterns.
Literature Cited
Blomquist, K.W. 1990. Selected life history and synecological characteristics of Ashe juniper on the Edwards Plateau of Texas. M.S. Thesis, Dept. Range Sci., Texas A&M Univ., College Station, TX.
Fuhlendorf, S.D. 1992. Influence of age / size and grazing history on understory relationships of Ashe juniper. M.S. Thesis, Dept. Rangeland Ecology and Management, Texas A&M Univ., College Station, TX.
Fuhlendorf, S.D., F.E. Smeins, and W.E. Grant. 1996. Simulation of a fire-sensitive ecological threshold: a case study of Ashe juniper on the Edwards Plateau of Texas, USA. Ecological Modeling (In Press).
Garriga, M.D. 1997. Tradeoffs associated with increasing water yield from the Edwards Plateau, Texas: balancing private costs and public benefits. M.S. Thesis, Dept Rangeland Ecology and Management, Texas A&M Univ., College Station, TX. (In preperation)
Kroll, J.C. 1980. Habitat requirements of the Golden-cheeked warbler: Management implications. J. Range Manage. 33:60-65.
Reinecke, R.K. 1996. Ashe Juniper Seed production and Germination, Seedling Dynamics and Response of Live Oak/ Juniper Mottes to Summer Fire. M.S. Thesis, Dept. Rangeland Ecology and Management, Texas A&M Univ., College Station, TX.
Rollins, D. and B. Armstrong. 1994. Cedar through the eyes of wildlife. In: C.A. Taylor, Jr. (ed.), Juniper Management in the Edwards Plateau. Tech. Rep. 94-2. Texas A&M University Research Station at Sonora.
Rowan, R.C. and J.R. Conner. 1994. Economic Considerations in the Control of Ashe Juniper. In: C.A. Taylor, Jr. (ed.), Juniper Management in the Edwards Plateau. Tech. Rep. 94-2. Texas A&M University Research Station at Sonora.
Smeins, F.E., M.K. Owens, S.D. Fuhlendorf. 1994. Biology / Ecology of Ashe (Blueberry) Juniper. In: C.A. Taylor, Jr. (ed.) Juniper Management in the Edwards Plateau. Tech. Rep. 94-2. Texas A&M University Research Station at Sonora.
Yager, L.Y. 1993. Canopy, litter and allelopathic effects of Ashe juniper (Juniperus ashei Buckholz.) on understory vegetation. M.S. Thesis, Dept. Rangeland Ecology and Management, Texas A&M Univ., College Station, TX.
Comments: Allan McGinty, Professor and Extension Wildlife Specialist