R. A. Hicks and W. A. Dugas
Abstract
Ashe juniper (Juniperus ashei Buchh.) is increasing in density and areal coverage in the Edwards Plateau of Texas. These changes in community structure impact the water balance through their effect on transpiration and interception of precipitation, processes that are related to leaf area (LA). Our objective was to develop a rapid, non-destructive means of estimating LA of Ashe juniper by examining 1) the effects of canopy position on specific leaf area (SLA), 2) the effects of canopy position on LA, 3) total tree LA vs tree height, canopy diameter and canopy area, and 4) shoot LA vs. stem diameter and stem area. We harvested all leaf material from nine trees ranging in height from 2.6 to 16 ft. and recorded tree height and canopy diameter. We divided each tree into 6 sections based on three horizontal strata and two vertical hemispheres. Subsamples were collected from each section and full cylinder LA was calculated by multiplying projected LA by . Dried leaf biomass from each section was multiplied by the SLA to determine section LAs, which were summed to determine layer, hemisphere, and total tree LA. To examine the relationship between shoot LA and stem diameter, we harvested leaf biomass from shoots and measured stem diameters, dried the leaf biomass, and multiplied it by the SLA to determine shoot LA. There were no significant effects of canopy position on SLA or of hemisphere on LA. The middle stratum of the trees had a significantly greater percentage of total LA (52%), while the top and bottom strata were not significantly different from each other. Total tree LA was best predicted by canopy area while shoot LA was best predicted by stem area. For this species in this region, canopy and stem area measurements are a rapid, non-destructive means of accurately estimating tree and shoot LA, respectively.
Introduction
Density and areal coverage of Ashe juniper (Juniperus ashei Buchh.) have increased on Texas rangelands in the last 100 years (Smeins et al. 1994). This change in community structure has decreased both herbaceous production (Taylor and Smeins 1994, Thurow and Carlson 1994) and the fraction of precipitation available for runoff and soil moisture recharge (Dugas et al. 1996). Ashe juniper impacts the plant community water balance through it’s effect on transpiration (Owens and Schreiber 1992, Dugas et al. 1996, Owens 1996) and precipitation interception (Thurow and Carlson 1994), both of which are directly related to plant and community leaf area (LA). Therefore, accurate estimates of Ashe juniper LA are useful for examining changes in community structure and function.
Due to the difficulties of directly measuring LA on trees in the field, various indirect methods of estimating LA have been developed (Miller et al. 1987). Smith et al. (1991), Gower and Norman (1991), and DeBlonde et al. (1994) have shown that methods using measurement of tree and stem characteristics produce better estimates of conifer LA and leaf area index (LAI) than those derived from light interception or plant canopy analyzer measurements.
Estimates of whole tree LA from tree and stem characteristics typically rely on field measurement of such factors as tree or canopy height, trunk diameter or sapwood area at breast height or crown base, and specific leaf area (SLA, the leaf area per unit dry leaf weight) (White 1983, Jurik et al. 1985, Gower et al. 1987, Miller et al. 1987, Chapman and Gower 1991, Coyea and Margolis 1992, Vertessy et al. 1995, McCrady and Jokela 1996). Trunk diameter and sapwood area are not easily obtained for Ashe juniper because it has numerous main stems that emerge from a short, furrowed trunk, and it often forms a broad globular or open, irregular crown (Correll and Johnston 1970). Mason and Hutchings (1967) determined that canopy diameter measurements produced accurate estimates of foliage yield in Juniperus osteosperma.
Accurate estimate of LA at a particular site from tree and stem characteristics depends on measurement of SLA at that site due to the potential influence of site-specific environmental factors such as precipitation and soil type on SLA (Sprugel 1989, Cregg 1992, Callaway et al. 1994). In addition to variation between spatially distant sites, SLA has been shown to vary between individuals at a site due to available soil water gradients (Kramer and Kozlowski 1979) and vary within the canopy of a plant due to light gradients. For example, sunlit leaves often have lower SLA than shaded leaves in grasses, broad-leaved trees, and conifers (Woodward 1983, Hager and Sterba 1984, Rawson et al. 1987, Wang et al. 1990, Chapman and Gower 1991, Cregg 1992, McCrady and Jokela 1996).
Few studies are available that estimate LA for individual Ashe juniper trees in the Edwards Plateau. The objective of this study was to develop rapid, non-destructive methods of estimating Ashe juniper tree and shoot LA by quantifying the relationships between 1) SLA and canopy position, 2) LA and canopy position, 3) tree LA and tree height, canopy diameter and canopy area, and 4) shoot LA and stem diameter and stem area.
MATERIALS AND METHODS
Study Site
This study was conducted about 42 miles west of San Antonio, TX, U.S.A. in the northeast corner of Uvalde County (29o35’N, 99o27’W). The site was at an elevation of about 1500 ft on a south facing slope of about 10%. Soils belong to the Rockland-Real-Eckrant association (Lithic Haplustolls and Typic Calciustolls) (USDA-SCS and TAES 1970). They are shallow to very shallow and gravelly, loamy and clayey with 35 to 85% coarse fragments, and underlain at 4 to 20 inches by indurated, fractured, limestone bedrock.
Average annual precipitation is about 30 inches with maxima in May and September. The average minimum January temperature is 35 oF and the average maximum August temperature is 95 oF. The freeze-free period, about 230 days, begins about March 25 (NOAA 1978 and 1985).
Vegetation
About 90% of the approximately 400 trees per acre at the site were Ashe juniper (Dugas et al. 1996). Trees ranged from 2.6 ft to about 16 ft (average= 8.7 ft) in height and had multiple stems rising from an irregular, basal crown. Historical land management practices indicate trees we sampled were less than 40 years old.
Procedures
Nine trees were harvested from February through September 1995. Tree height (which was equal to canopy height) and canopy diameter were recorded for each tree. Tree height was measured from the soil surface to the tallest point of the tree. Diameter was measured in two perpendicular directions, with one being the longest canopy dimension (visually estimated). Canopy area was calculated using the average diameter and assuming the canopy was circular. Trees were selected that had medium density foliage (Mason and Hutchings 1967) and no close neighbors (within 5 ft) that affected the canopy.
Each tree was divided into 6 sections based on 3 horizontal strata and 2 vertical hemispheres. The three strata were top, middle, and bottom, with the height of each layer being 1/3 of total tree height. Hemispheres were defined by a northeast to southwest vertical plane through the canopy center (Owens 1996).
Junipers are evergreen conifers with scale leaves arranged in whorls around the twig (Correll and Johnston 1970). Miller et al. (1987) and Cregg (1992) defined the “needle-like clumps of scale leaves” as a juniper leaf for purposes of estimating juniper tree LA. For this study, we used this definition.
Fresh samples were collected from eachtree,oneper section, for calculating the leaf area per unit dry leaf weight or specific leaf area (cm2/g). Each group of clumps on each twig was dissected to individual, needle-like units to reduce error of projected LA. Projected LA of the fresh subsamples was measured by passing the ‘leaves’ through an area meter (LiCor LI3000, Lincoln, Nebraska) and multiplying the resulting 2 dimensional area by (3.1415) to obtain the area of the 3 dimensional cylinder comprised of the twig and the scale leaves arranged in whorls around it. We have called this “full cylinder LA” because it is the total green surface area of the cylindrical twig. This method is reported to underestimate LA by 3 to 10%, but corrects for curvature of the juniper leaf (Miller et al. 1987, Cregg 1992) and accounts for the non-random distribution and orientation of conifer leaves (Sprugel 1989, Gower and Norman 1991). Subsamples were dried and weighed and SLA calculated by dividing the full cylinder LA by dry weight.
Leaf area in each tree section was determined by removing all stems and attached leaves, drying this material at 140 oF for about 7 days, and separating stems from leaves. Leaf biomass was then dried for 5 more days, weighed and multiplied by the average SLA, which was constant across trees and sections (see below), to determine section LA. Section LAs were summed to calculate LA for the tree, stratum or hemisphere.
Data (n=97) from the SLA subsamples and shoots from other trees in the study area were used to examine the relationship between stem diameter or stem area and shoot LA. Shoots were chosen from both hemispheres of trees with medium density foliage and no nearby neighbors. While the branch was on the tree, two perpendicular measurements of stem diameter, including the bark, were made with digital calipers at a point where the stem was not deformed by branching. The distance from this point to the next branch out from the main trunk ranged from 0.5 to 6 inches. All leaf biomass and twigs from the measurement point out were removed from the shoot, dried, separated, and re-dried. Leaf biomass was weighed and multiplied by the average SLA to determine shoot LA. Stem area was calculated using the average stem diameter and assuming the stems were circular.
Statistical Analyses
Analysis of variance (AOV) was used to compare SLA across sections, strata, hemispheres, and trees. For a given tree or section of tree, LA was a function of tree size (see below). Therefore, the percentage of total tree LA in each layer and hemisphere was used in the AOV to compare LA across strata and hemispheres. Relationships between LA and plant measurements were analyzed using linear least-squares regression. The Shapiro-Wilk statistic and scatterplots of residuals were used to test normality and random distribution, respectively (SAS Institute 1988).
RESULTS AND DISCUSSION
Specific Leaf Area
There were no significant differences (P=0.62; AOV) in SLA throughout the sections of the nine trees that were sampled (Table 1), nor were there significant effects of tree size or harvest date on SLA (results not shown). Our average SLA was within the range of SLAs reported for other conifers (Table 2), but is lower than that measured for Ashe juniper in Bell County, Texas, by Johnson (unreported data), likely due to methodological and site differences (Callaway et al. 1994).
Methodological differences can occur because there is no clearly defined, physical point at which the leaf begins or ends. However, our maximum SLA was 85, suggesting similar methodologies may have been used by Johnson and us and that site differences are important.
Table 1.
| Section | SLA (cm2 g-1) |
| Northwest-Top | 54.9 (4.7) |
| Northwest-Middle | 52.7 (8.5) |
| Northwest-Bottom | 53.5 (4.9) |
| Southeast-Top | 56.1 (11.8) |
| Southeast-Middle | 51.9 (4.1) |
| Southeast-Bottom | 56.3 (10.6) |
| Average | 54.3 (7.9) |
Sample standard deviation in parentheses.
Table 2.
| Species | SLA(cm2 g-1) | Reference |
| Juniperus ashei | 69-8954.3 | Johnson, unpub datathis paper |
| J. occidentalis | 63 | Miller et al. (1987) |
| J. pinchotii | 55.5 | Ansley, unpub data |
| J. scopulorumJ. virginiana | 111-122 | Cregg (1992) |
| Picea abies | 50 | Hager and Sterba (1984) |
| Pinus contorta | 80 * | Gower et al. (1987) |
| P. elliottii | 84-136 | Dalla-Tea and Jokela (1991) |
| P. ponderosa | 54-60 * | Callaway et al. (1994) |
| P. radiata | 44-66 | Wang et al. (1990) |
| P. taeda | 165-187100-171 | McCrady and Jokela (1996)Dalla-Tea and Jokela (1991) |
| Pseudotsugamenziesii | 130* 89* | Borghetti et al. (1986)Gower et al. (1987) |
* SLA converted to full cylinder or two sided values.
The site in Bell County differs from our Uvalde County study site in that mean annual precipitation is greater by about 100 mm, vapor pressure deficits are lower by about 10% (NOAA 1978), and the soils have about 0.05 m more water holding capacity per m of soil profile (USDA-SCS and TAES 1970 and 1971). Differences in our SLA and those of Johnson underscore the need for estimating LA from tree and stem characteristics on site-specific SLA.
Spatially-uniform SLA within the canopy and across trees (Table 1) is unusual (Woodward 1983, Hager and Sterba 1984, Borghetti et al. 1986, Rawson et al. 1987, Wang et al. 1990, Allard et al. 1991, Chapman and Gower 1991, Dalla-Tea and Jokela 1991, Cregg 1992, Vertessy et al. 1995, McCrady and Jokela 1996). The effects of light intensity on SLA of Ashe juniper at our study site may be masked by all of the following: 1) the interaction of xeric soils with micro-habitat, 2) chemical and structural defenses against herbivory and transpiration losses, and 3) multi-aged leaves in our subsamples. Leaves produced along environmental and seasonal water gradients show decreased SLA as available water decreases (Kramer and Kozlowski 1979, Westman 1981, Ansley et al. 1992). Also, as leaves age, chemical and structural components that decrease SLA are produced to deter herbivory (Archer and Tieszen 1980, Mooney and Gulmon 1982, Bryant et al. 1983) and limit transpiration losses (Werger and Ellenbroek 1978, Westman 1981, Nobel 1983). Because we did not differentiate current year foliage from prior year foliage and evergreens characteristically maintain leaf material for several years (Sprugel 1989), we included multi-aged leaf material in each SLA sample.
Canopy Section Leaf Area
LA on the southeast and northwest hemispheres of the trees was essentially equal (P=0.67; AOV) (Fig. 1). This equality of LA in each hemisphere is similar to the results of Owens (1996) who showed that the southeast side of Ashe juniper had only 7% more LA than the northwest side.
Leaf area was almost always greatest in the middle stratum (Fig. 2) and increased non-linearly as a function of tree height. The middle stratum LA, as a percentage of tree LA, was significantly (P=0.0001; AOV) greater (52%) than that in the bottom and top strata (19 and 29%, respectively), which were not significantly different. Owens (1996) also found that 54% of total Ashe juniper LA was in the middle stratum and there was no significant difference in the bottom and top strata. McCrady and Jokela (1996) found more than 60% of total LA in the middle stratum of the canopy of loblolly pine trees.
Ashe juniper canopies have “a broadly globular growth form that usually branches near the base” (Smeins et al. 1994). This describes the shape of most of the trees in our study (personal observation). The longest diameter of most of our study trees occurred within the middle canopy stratum and may partly explain the greater LA in the middle stratum. The largest study tree had a more conical form (personal observation), with the longest diameter being within the bottom canopy stratum which may explain why it had more LA in the bottom stratum (Fig. 2).
Total Tree Leaf Area
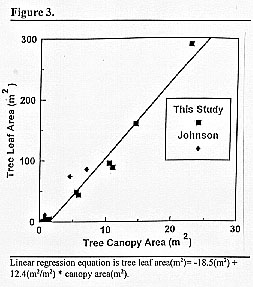
Total tree LA was related linearly to canopy area (r2=0.97) (Fig. 3 Linear regression equation is tree leaf area(m2)= -18.5(m2) + 12.4(m2/m2) * canopy area(m2). ). Inclusion of the largest tree, although justified because the r2 was not improved when it was removed from the analyses, increased the slope by about 20%. Our measurements agree well with measurements by Johnson (unpublished data). Total tree LA was non-linearly related to tree height (Fig. 2) and diameter (results not shown). The linear relationship between LA and canopy area indicates that, for Ashe juniper trees similar to those we selected, total tree LA can be easily and accurately estimated from canopy diameter that could, for example, be measured from aerial photographs. This would allow rapid assessment of Ashe juniper tree LA over large areas.
Canopy LAI for these individual trees was linearly related to tree height (Fig. 4 Linear regression equation (r2=0.91) is canopy LAI(m2/m2) = 1.83(m2/m2) + 2.26(m2/m2) * tree height(m).). LAIs from this study are similar to Ashe juniper canopy LAIs of 12 to 17 measured by Owens (1996) and Johnson (personal communication) and to LAIs (1.5 to 20) reported for other conifers in studies of trees of various age and size (Jarvis and Levernz 1983, Levernz and Hinckley 1990, Gower and Norman 1991, DeBlonde et al. 1994). LAI increased with tree size due to the increasing vertical surface area over which leaf material was formed and to the evergreen characteristic of adding new layers of leaf material each year while retaining much of the older layers (Sprugel 1989).
Shoot Leaf Area
Shoot LA was related linearly to stem area (r2=0.93) (Fig. 5). Several studies have found that sapwood area is a good predictor of LA (r2=0.70 to 0.95) (Borghetti et al. 1986, Coyea and Margolis 1992, Callaway et al. 1994), while others have used stem diameter or circumference (r2=0.78 to 0.99) (Gower et al. 1987, Miller et al. 1987). Johnson’s data (personal communication) for stems from a single Ashe juniper tree in Bell County, Texas, also showed that shoot LA was linearly related to stem area (results not shown). The linear relationship of shoot LA to stem area in this study allows easy, accurate estimation of total shoot LA from non-destructive, stem diameter measurements.
Conclusions
This study of Ashe juniper leaf area (LA) indicates that canopy position had no effect on specific leaf area (SLA); fifty percent of total tree LA occurred in the middle, horizontal stratum of the canopy; and LA was equal in the southeast and northwest hemispheres. Because there was no effect of canopy position on SLA and no significant difference in percentage of LA in the two hemispheres, the significant difference in stratum LA is believed to be related to tree shape rather than anatomical or physiological factors.
Total tree LA was best estimated by canopy area and shoot LA was best estimated by stem area. Accurate estimates of total tree LA and shoot LA can be made from rapid, non-destructive measurements of canopy and stem diameter, respectively. Results from this study can be used in studies of other Juniperus species such as J. virginiana, J. osteosperma, and J. pinchotii which have similar leaf structure and tree shape and size. Our results are likely not appropriate for very mature trees whose canopy shape may change considerably or for trees whose canopy is significantly affected by nearby vegetation. Ashe juniper trees also exhibit sparse, medium and dense foliage canopies similar to Utah juniper whose biomass yield was shown to vary two fold by Mason and Hutchings (1967). Therefore, further studies are needed to validate these relationships for groups of clustered trees and for a range of foliage densities.
Literature Cited
Allard, G., C. J. Nelson and S. G. Pallardy. 1991. Shade effects on growth of tall fescue: I. leaf anatomy and dry matter partitioning. Crop Sci. 31:163-167.
Ansley, R. J., D. L. Price, S. L. Dowhower and D. H. Carlson. 1992. Seasonal trends in leaf area of honey mesquite trees: determination using image analysis. J. Range Manage. 45:339-344.
Archer, S. and L. L. Tieszen. 1980. Growth and physiological responses of tundra plants to defoliation. Arctic and Alpine Res. 12:531-552.
Borghetti, M., G. G. Vendramin and R. Giannini. 1986. Specific leaf area and leaf area index distribution in a young Douglas-fir plantation. Can. J. For. Res. 16:1283-1288.
Bryant, J. P., F. S. Chapin III and D. R. Klein. 1983. Carbon/nutrient balance of boreal plants in relation to vertebrate herbivory. Oikos 40:357-368.
Callaway, R. M., E. H. Delucia and W. H. Schlesinger. 1994. Biomass allocation of montane and desert ponderosa pine: an analog for response to climate change. Ecology 75:1474-1481.
Chapman, J. W. and S. T. Gower. 1991. Aboveground production and canopy dynamics in sugar maple and red oak trees in southwestern Wisconsin. Can. J. For. Res. 21:1533-1543.
Correll, D. S. and M. C. Johnston. 1970. Manual of the Vascular Plants of Texas. P 78-79. Pub. Texas Research Foundation, Renner, TX.
Coyea, M. R. and H. A. Margolis. 1992. Factors affecting the relationship between sapwood area and leaf area of balsam fir. Can. J. For. Res. 22:1684-1693.
Cregg, B. M. 1992. Leaf area estimation of mature foliage of Juniperus. For. Sci. 38:61-67.
Dalla-Tea, F. and E. J. Jokela. 1991. Needlefall, canopy light interception, and productivity of young intensively managed Slash Pine stands. For. Sci. 37:1298-1313.
DeBlonde, G., M. Penner and A. Royer. 1994. Measuring leaf area index with the Li-Cor LAI-2000 in pine stands. Ecology 75:1507-1511.
Dugas, W. A., R. A. Hicks, P. Wright and G. Lindemann. 1996. Effect of removal of Juniperus ashei on evapotranspiration and runoff in the Seco Creek watershed. In: Seco Creek Water Quality Demonstration Project, 1996 Ann. Proj. Rep.
Gower, S. T., C. C. Grier, D. J. Vogt and K. A. Vogt. 1987. Allometric relations of deciduous (Larix occidentalis) and evergreen conifers (Pinus contorta and Pseudotsuga menziesii) of the Cascade Mountains of central Washington. Can. J. For. Res. 17:630-634.
Gower, S. T. and J. M. Norman. 1991. Rapid estimation of leaf area index in conifer and broad-leaf plantations. Ecology 72:1896-1900.
Hager, H. and H. Sterba. 1984. Specific leaf area and needle weight of Norway spruce (Picea abies) in stands of different densities. Can. J. For. Res. 15:389-392.
Jarvis, P. G. and J. W. Leverenz. 1983. Productivity of temperate, deciduous and evergreen forest. P. 233-280. In Physiological Plant Ecology IV. Encyclopedia of Plant Physiology Vol. 12D. Eds. O.L. Lange et al. Springer-Verlag, Berlin.
Jurik, T. S., G. M. Briggs and D. M. Gates. 1985. A comparison of four methods for determining leaf area index in successional hardwood forests. Can. J. For. Res. 15:1154-1158.
Kramer, P. J. and T. T. Kozlowski. 1979. Physiology of Woody Plants. P. 58-83. Academic Press, New York.
Leverenz, J. W. and T. M. Hinckley. 1990. Shoot structure, leaf area index and productivity of evergreen conifer stands. Tree Physiol. 6:135-149.
Mason, L. R. and S. S. Hutchings. 1967. Estimating foliage yields on Utah juniper from measurements of crown diameter. J. Range Manage. 20:161-166.
McCrady, R. L. and E. J. Jokela. 1996. Growth phenology and crown structure of selected loblolly pine families at two spacings. For. Sci. 42:46-57.
Miller, R. F., L. E. Eddleman and R. F. Angell. 1987. Relationship of western juniper stem conducting tissue and basal circumference to leaf area and biomass. Great Basin Nat. 47:349-354.
Mooney, H. A. and S. L. Gulmon. 1982. Constraints on leaf structure and function in reference to herbivory. BioScience 32:198-206.
NOAA. 1978. Climatography of the United States, No. 20. National Climatic Data Center, National Oceanographic and Atmospheric Administration, Asheville, NC.
NOAA. 1985. Climatography of the United States, No. 20. Climatic summaries for selected sites, 1951-1980, Texas. National Climatic Data Center, National Oceanic and Atmospheric Administration. Asheville, NC.
Nobel, P. S. 1983. Biophysical Plant Physiology and Ecology. W.H. Freeman and Co. New York.
Owens, M. K. 1996. The role of leaf and canopy-level gas exchange in the replacement of Quercus virginiana (Fagaceae) by Juniperus ashei (Cupressaceae) in semiarid savannas. Am. J. Bot. 83:617-623.
Owens, M. K. and M. C. Schreiber. 1992. Seasonal gas exchange characteristics of two evergreen trees in a semiarid environment. Photosynthetica 26(3):389-398
Rawson, H. M., P. A. Gardner and M. J. Long. 1987. Sources of variation in specific leaf area in wheat grown at high temperature. Aust. J. Plant Physiol. 14:287-298.
SAS. 1988. SAS/STAT User’s Guide-Release 6.03 edition. and SAS Procedures Guide-Release 6.03 edition. SAS Institute. Cary, NC.
Smeins, F. E., M. K. Owens and S. D. Fuhlendorf. 1994. Biology and ecology of Ashe (Blueberry) juniper. P 9-24. in Texas A&M University Research Station at Sonora, Juniper Symposium 1994. Tech. Rep. 94-2.
Smith, F. W., D. A. Sampson and J. N. Long. 1991. Comparison of leaf area index estimates from tree allometrics and measured light interception. For. Sci. 37:1682-1688.
Sprugel, D. G. 1989. The relationship of evergreenness, crown architecture and leaf size. Am. Nat. 133:465-479.
Taylor, C. A. and F. E. Smeins. 1994. A history of land use of the Edwards Plateau and its effect on the native vegetation. P 1-8. in Texas A&M University Research Station at Sonora, Juniper Symposium 1994. Tech. Rep. 94-2.
Thurow, T. L. and D. H. Carlson. 1994. Juniper effects on rangeland watersheds. P 31-43. in Texas A&M University Research Station Sonora, Juniper Symposium 1994. Tech. Rep. 94-2.
USDA-SCS and TAES. 1970. Soil Survey of Uvalde County, Texas. United States Department of Agriculture-Soil Conservation Service and Texas Agricultural Experiment Station.
USDA-SCS AND TAES. 1971. Soil Survey of Bell County, Texas. United States Department of Agriculture-Soil Conservation Service and Texas Agricultural Experiment Station.
Vertessy, R. A., R. G. Benyon, S. K. O’Sullivan and P. R. Gribben. 1995. Relationships between stem diameter, sapwood area, leaf area and transpiration in a young mountain ash forest. Tree Physiol. 15:559-567.
Wang, Y. P., P. G. Jarvis and M. L. Benson. 1990. Two-dimensional needle-area density distribution within the crowns of Pinus radiata. For. Ecol. and Manage. 32:217-237.
Werger, M. J. A. and G. A. Ellenbroek. 1978. Leaf size and leaf consistence of a riverine forest formation along a climatic gradient. Oecologia 34:297-308.
Westman, W.E. 1981. Seasonal dimorphism of foliage in a Californian Coastal sage scrub. Oecologia 51:385-388.
White, P. S. 1983. Corner’s rules in eastern deciduous trees: allometry and its implications for the adaptive architecture of trees. Bull. Torrey Bot. Club. 110:203-212.
Woodward, F. I. 1983. The significance of interspecific differences in specific leaf area to the growth of selected herbaceous species from different altitudes. New Phytol. 95:313-323.
Comments: Allan McGinty, Professor and Extension Wildlife Specialist